As developers of econometric software, one of the most
common questions we are asked is how we decide which features to add to the
next release of EViews.
There isn’t an easy way to answer this question – the
process is often fluid and is different for every feature. Feature ideas
generally come to us from one of the following sources:
·
- Directly from our user base,
either on the EViews forum, through our technical support channels or through face to face meetings.
- From reading journal articles and
text books to discover the latest trends in the field.
- From visiting academic and
professional conferences, such as ASSA, NABE or ISF.
- From meetings held at our user
conferences.
- Research from our development team.
The recent release of EViews 9.5 gives us a
chance to explore the process with some examples.
MIDAS
Perhaps the most anticipated feature in EViews 9.5 is MIDAS estimation, which
allows estimation of regression models using data of different frequencies. MIDAS
first came to our attention a few years ago during a casual conversation
between our developers and one of our academic users at the Joint Statistical Meetings.
Our user suggested that EViews’ natural handling of data
from different frequencies and our emphasis on time series analysis, coupled
with MIDAS’ growing popularity made it a great candidate for a new feature.
Following up on that discussion, our development team began researching what would be involved in adding MIDAS to EViews. MIDAS would be the
first estimation technique in EViews that inherently uses data based on
different workfile pages.
While later attending the EViews co-sponsored ISF conference, we also noticed that a large part of the conference was devoted to MIDAS
estimation and forecasting as well as nowcasting. By this time we were convinced that MIDAS was
an obvious choice to add to EViews.
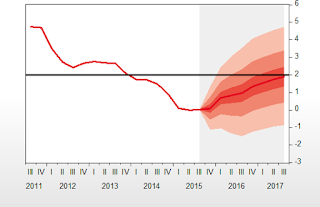
 We are often asked if EViews can produce fan charts. At its heart, a fan chart is simply a type of area band chart. EViews has been able to produce area band charts for a number of previous versions. So whenever we have been asked if EViews can produce fan charts, we have said “yes”.