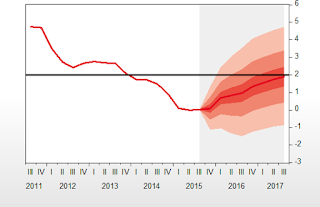
 We are often asked if EViews can produce fan charts. At its heart, a fan chart is simply a type of area band chart. EViews has been able to produce area band charts for a number of previous versions. So whenever we have been asked if EViews can produce fan charts, we have said “yes”.
Recently, we decided to go one step further and replicate an official Bank of England fan chart in EViews, and this blog post will document the steps required to perform the replication.
We have decided to replicate a recent inflation report fan chart, specifically the November 2015 inflation fan chart available from the Bank of England.
